
Table of Contents
ToggleWhat to look for in a product comparison starts with clear purpose: specify the task, the environment, and how often the product will be used. The best comparisons begin by separating must-haves from nice-to-haves and by naming the scenarios that matter, daily use, occasional heavy load, travel, or professional deployment. This article guides readers through a step-by-step approach that turns vague reviews into actionable decisions. It prepares them to choose metrics, run repeatable tests, and weigh real costs so choices match real life, not marketing copy.
Contents
Key Takeaways
- Successful product comparisons start by clearly defining your needs, priorities, and specific use cases to avoid buyer’s remorse.
- Separate must-have features from nice-to-have ones to focus your evaluation on essential criteria and prevent feature overload.
- Use quantitative metrics that directly relate to your intended use, such as performance, capacity, and reliability, to make objective comparisons.
- Incorporate qualitative factors like ease of use, build quality, and customer support to assess user experience beyond numbers.
- Apply standardized, reproducible tests in controlled environments to generate reliable data and compare products fairly.
- Evaluate total cost of ownership including price, maintenance, and warranty to understand the real financial impact over time.
Define Your Needs, Priorities, And Use Cases
Start with the clear fact: define what the product must do before comparing options. A shopper who lists exact tasks saves time and avoids buyer’s remorse.
A practical example: a homeowner who needs a vacuum for pet hair on hardwood three times per week has a different priority list than a renter who needs a compact model for occasional carpet cleaning. Write down the primary task, the environment (home, workshop, office), frequency (daily, weekly, monthly), and any constraints (storage space, noise limits, budget ceiling).
Separate requirements into two columns: “must-have” and “nice-to-have.” Must-have items are non-negotiable: compatible filters, minimum battery runtime, or a specific size. Nice-to-have items include color, Wi‑Fi app integration, or premium accessories. This separation prevents feature overload when reading spec sheets.
A candid lesson: they once bought a highly rated cleaner because of one flashy spec (a long battery life claimed on the box) and later discovered the runtime dropped 40% under real conditions. That error came from skipping frequency and load testing in the initial needs definition. Building a short checklist with precise numbers, e.g., “45 minutes runtime at medium suction”, fixes that.
Practical tip: turn the checklist into the first row of a comparison table so every model is scored against the same baseline. For guidance on forming those baseline rules, readers can consult a short primer on how to use buying guides, which explains how to convert needs into measurable test conditions.
Identify Core Performance Metrics That Matter
Core insight first: metrics should map directly to the intended use. Choose measurable outcomes that indicate real-world value rather than marketing-friendly numbers.
If speed matters, measure throughput or cleaning rate. If longevity matters, use mean time between failures and observed defect rates. If portability matters, use weight and packed dimensions. This short discipline avoids comparisons that mix apples and oranges.
Two follow-up questions guide the next steps: which metrics are quantitative and which are qualitative? The following sub-sections split the work so readers can test like a pro.
Key Quantitative Metrics To Compare
Answer first: measure what you can count. Quantitative metrics provide objective anchors for decisions.
Examples readers should capture: performance (throughput, response time), capacity (battery minutes, storage liters), efficiency (watt-hours per cycle), reliability (failure rate or MTBF), and compatibility (supported standards, ports, dimensions). Use precise units: list runtime in minutes, airflow in cubic feet per minute, or load in kilograms. Avoid vague terms like “fast” or “large.”
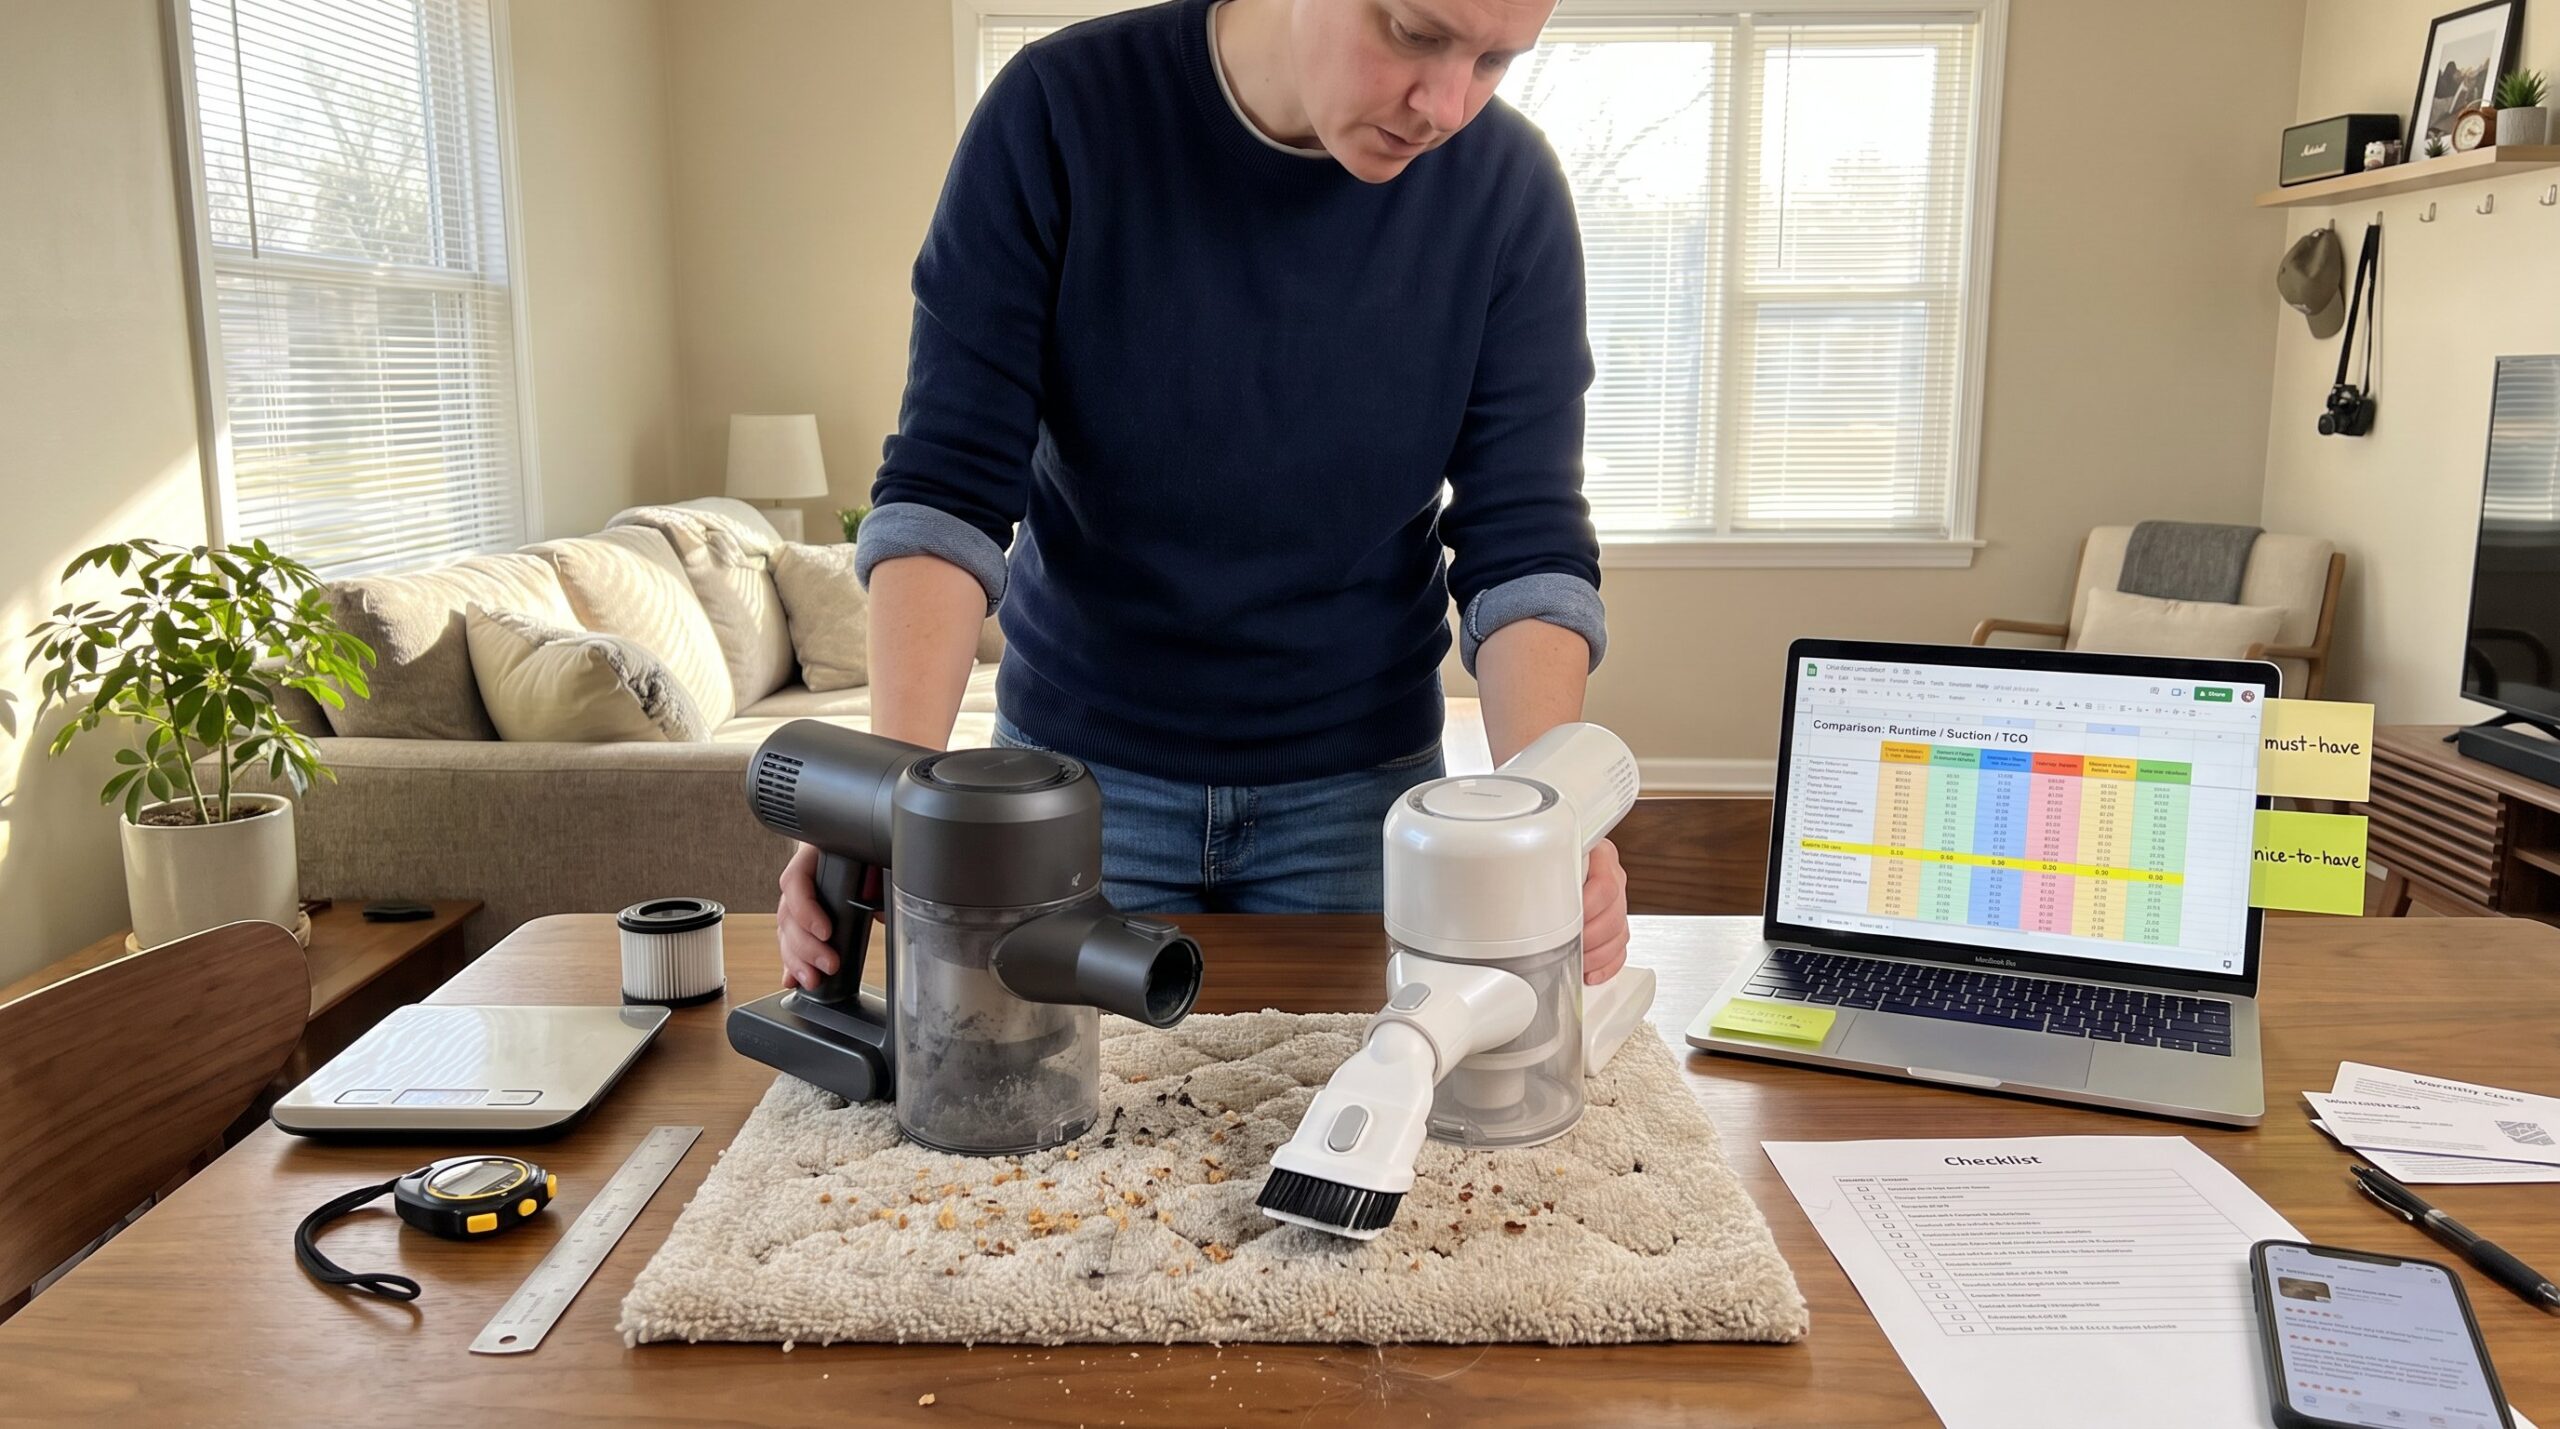
A concrete test scenario: to compare cordless vacuums, run a 10‑minute cleaning cycle on the same 10 sq ft patch of mixed debris and record the percent of debris removed, battery drop, and time to empty the bin. Repeat three times and average results. That produces numbers that reflect actual performance under your defined use case.
When claiming testing methodology, it helps to reference how established reviewers create reproducible tests. For example, Tom’s Guide explains structured test steps and scoring that prioritize real usage, which can inform a household test plan: testing procedures. Use such references only to shape your protocol, not to replace your own data.
Key Qualitative Factors To Consider
State the core point: qualitative factors explain user experience where numbers fall short. They matter for daily satisfaction and long-term ownership.
Track build quality (materials and seam finishes), ease of use (intuitive controls, setup time), ergonomics (weight balance, handle comfort), design consistency (match between parts and documentation), and support quality (response time, clarity of instructions). Also note maintenance needs: frequency of filter changes, tool-less access, or special cleaners required.
Example: two models may have identical suction and runtime. The cheaper one, but, required a screwdriver to empty the dust bin: that small friction raised the effective time cost by five minutes per cleaning and produced a cumulative burden of about 4 hours per year for a homeowner who cleans weekly.
Collect user satisfaction patterns from verified reviews, but treat them as signals, not facts. Look for clusters: if 2,847 users report the same hinge failure after 18 months, that pattern matters more than a single glowing review. Capture such patterns in your comparison notes.
Create A Reproducible Testing And Comparison Method
Direct answer: use standardized, repeatable tests and record results in a fixed format. Reproducibility separates thoughtful comparison from anecdote.
Set the same test conditions for each product: identical inputs, environment, and timing. For example, test all vacuums on the same rug type, same pile of debris, and the same battery state. Repeat tests multiple times (three to five runs) and average results. Log raw numbers, notes, and any anomalies in a spreadsheet so the dataset remains auditable.
A working process looks like: define scenario → list metrics → run N repetitions → record raw data → compute averages and standard deviations → score against baseline. Add a baseline device where possible so every model compares to the same reference. This approach helps detect outliers and avoid one-off flukes.
For instructions on creating a baseline and using buying guides to structure those steps, incorporate the comparison basics into the method. Those pages provide templates and checklists that align with repeatable testing methods used by experienced reviewers.
Honest admission: early tests often fail because testers ignore environmental controls, humidity, surface wear, or inconsistent input loads skew results. Controlling these variables fixes false positives and gives confidence in the final recommendation.
Assess Total Cost, Warranty, And Real-World Reliability
Immediate point: the sticker price is only part of the cost equation. Include purchase price, accessories, installation, maintenance, consumables, repairs, and likely replacement intervals.
Calculate a simple total cost of ownership (TCO) for a fixed period, such as three years. Example: a $300 model plus $40/year in filters and a $60 initial accessory kit equals $460 over three years. Compare that to a $420 model with $10/year consumables and a two‑year warranty. The lower purchase price may cost more over time.
Inspect warranty terms carefully: length, what parts are covered, and the claims process. A 2‑year warranty that covers labor and parts reduces expected repair expenses more than a 1‑year limited warranty. Real-world reliability also comes from user-reported failure rates and service records: look for repeat patterns in verified returns data.
Practical warning: manufacturer uptime claims often come from lab settings that do not reflect heavy domestic use. Cross-reference lab numbers with long-term user reports and service bulletin data. For guidance on reading specifications and translating them into expected costs and lifespans, consult the short guide on reading specifications.
Conclusion
Final insight: an effective product comparison ties needs-based criteria to measurable metrics, then layers human-centered evaluation and cost analysis on top. The best choice minimizes practical risk and long-term expense for the intended use.
Readers who define use cases, pick meaningful metrics, run repeatable tests, and calculate total ownership will choose products that work in their lives, not just on the specification sheet. For a full set of templates and workflows that support this approach, visit the LivingPristine Buying Guides section and apply the checklists to your next purchase.